Animation of a GPS track in QGIS
Methods / Tools
Data Sources
This visualisation illustrates one weekend walk using GPS track data generated by his personal smart watch. The whole animation is conducted in QGIS, the open-source GIS software.
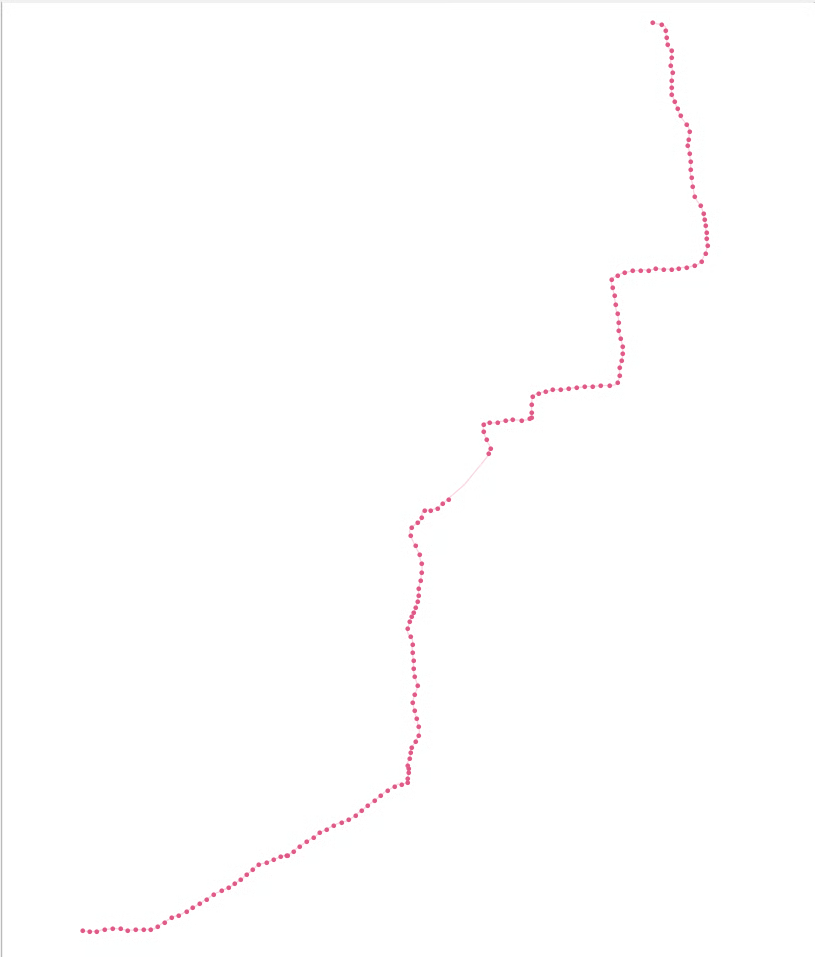
First, the GPS track data was exported from the smart watch and imported into QGIS, and configure proper mark size and color.
Besides, the mark type of ‘geometry generator’ is used to reduce the number of track points and to make the animation more readable.
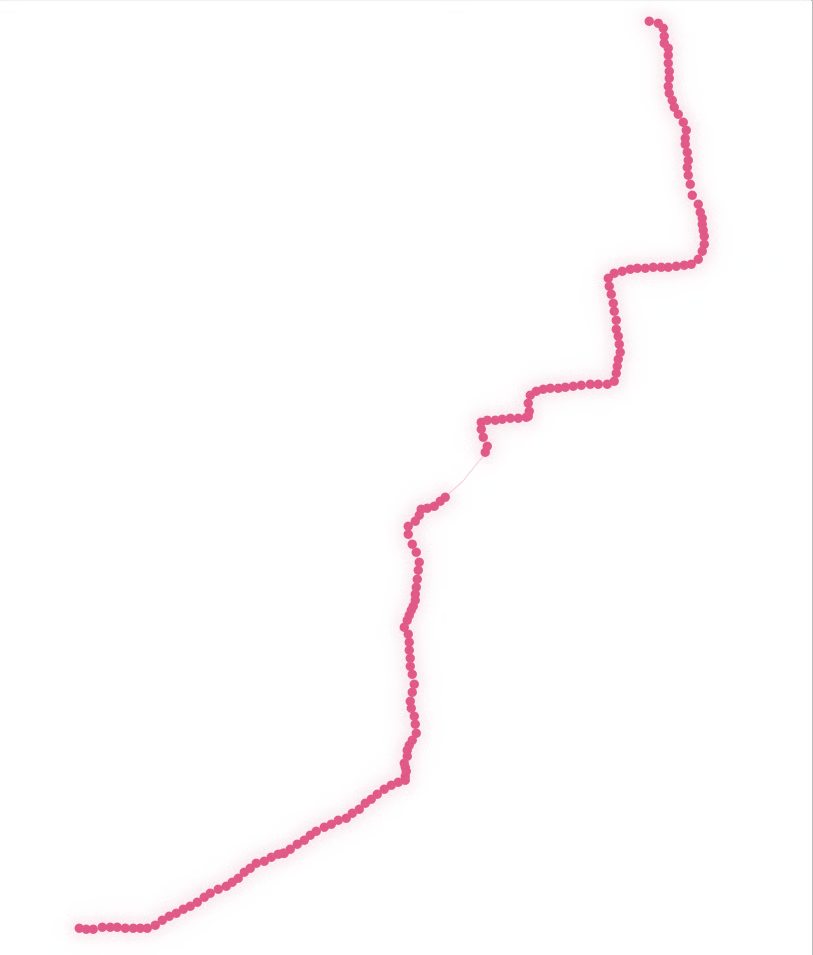
Second, duplicate the track points layer, set the marker with larger size and radiant effect.
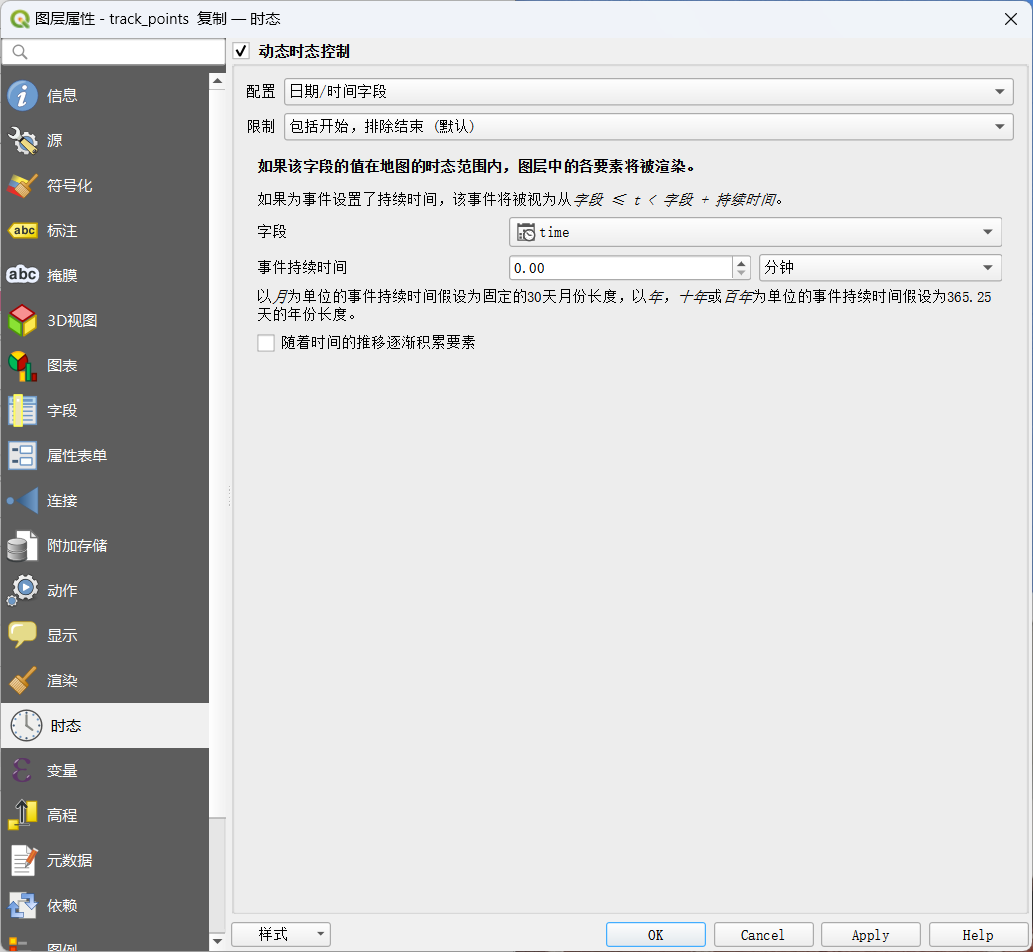
Third, edit the properties of the two track points layers, using the ‘time’ field to configure ‘Dynamic Temporal Control’.
Fourth, using the plugin QuickMapServices to load a dark base map. And create a point layer with label of time.
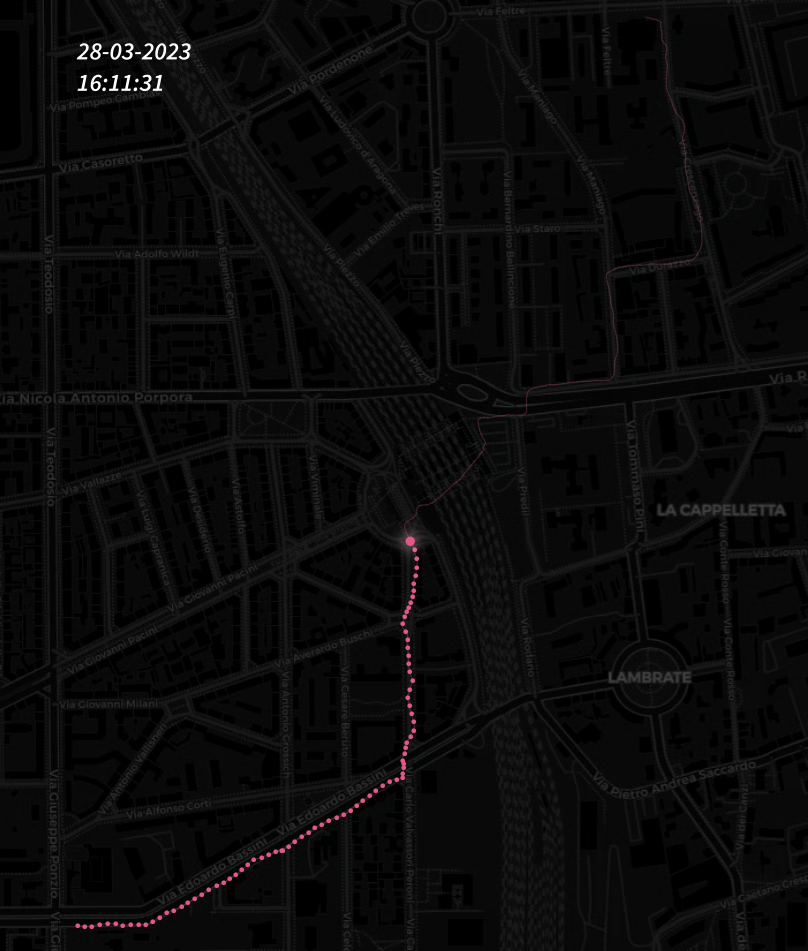
In the end, export the animation. The result is shown as follows: