Visualisation of Rivers in China Using Geo-Python
Methods / Tools
Data Sources
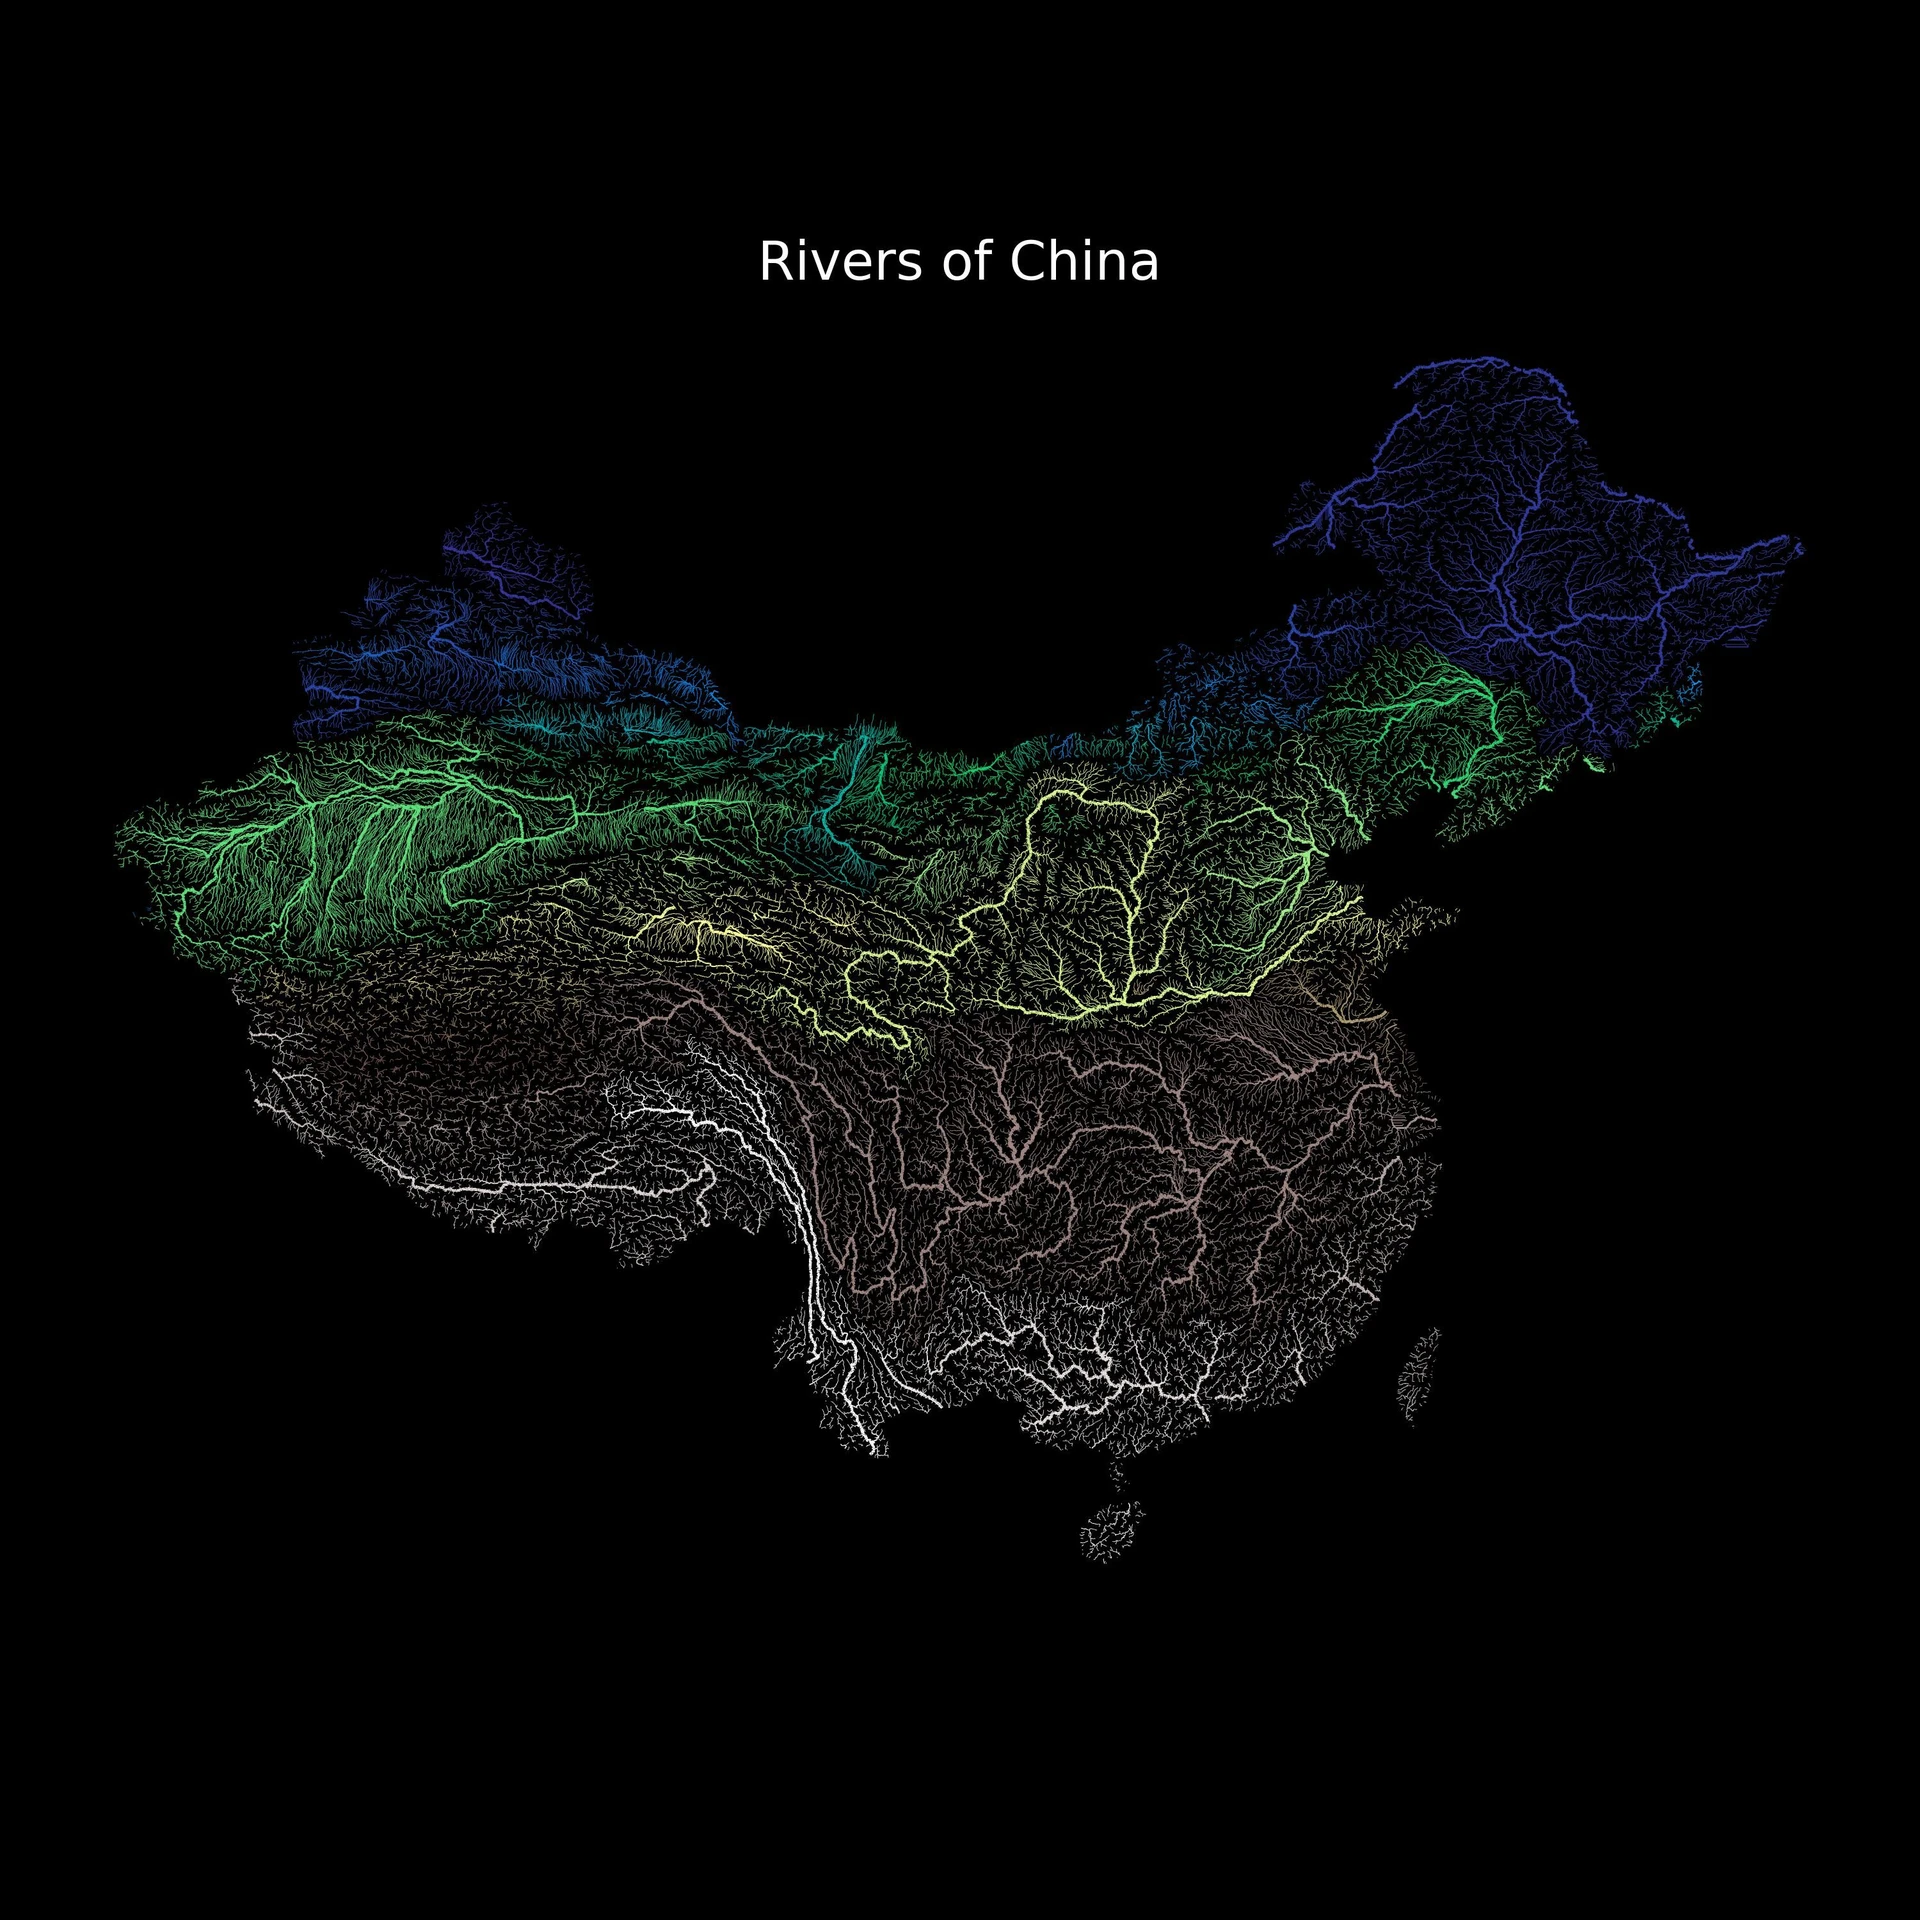
This visualization shows all the rivers in China, with different colors assigned to the rivers according to their main streams, and different line widths assigned to the rivers according to their drainage areas.
Data of the world rivers was acquired from HydroRIVERS, from which the rivers in China were filtered out using the borderline data acquired from National Geomatics Center of China (NGCC).
# Select the country and get its geometry
country_gdf = gpd.read_file()
country = 'China'
selected_country = country_gdf[(country_gdf['NAME'] == country)]

# Filter out the geometry of the rivers from the world rivers datasets
river_gdf = gpd.read_file(hydrorivers_filepath, mask=selected_country)
Then, based on the data in the drainage area column (UPLAND_SKM) in the geo data frame, create a new line width column (width) and assign a value between 0.2 and 1.0 to each row based on its drainage area.
original_min = 300
original_max = 30000
target_min = 0.2
target_max = 1.0
scaled = (river_gdf['UPLAND_SKM'] - original_min) / (original_max - original_min)
river_gdf['width'] = scaled.clip(0, 1) * (target_max - target_min) + target_min
river_gdf_final = river_gdf.sort_values(['UPLAND_SKM', 'width'])[
    ['MAIN_RIV', 'UPLAND_SKM', 'width', 'geometry']]
In the end, great plot and save the figure, where each river is assigned a color in the colormap according to the value in the main stream column (MAIN_RIV).
fig, ax = plt.subplots(figsize=(10, 10))
title = f'Rivers of {country}'
fig.patch.set_facecolor('black')

river_gdf_final.plot(
    ax=ax,
    categorical=True,
    column='MAIN_RIV',
    cmap = 'terrain',
    linewidth = river_gdf_final['width']
)

ax.set_axis_off()
plt.tight_layout()
ax.set_title(title, color='white', fontsize=20)

plt.savefig('Rivers in China.jpg', dpi = 300)
plt.show()
The final visualisation is shown as follows: