Analysis on the Space Network of Zhengding and Its Expansion
Methods / Tools
Data Sources
Zhengding (正定) is a small historic city in North China, which was first established in the 7th century and grew into a regional centre. In the early 20th century, the city’s economic and political status dramatically declined due to the detour of major railway routes. The built-up area within the city walls of Zhengding shrank significantly as a consequence. Later, as a result of the economic reform in China in the 1980s, the city sprawled rapidly in the following decades, which is the particular focus of this analysis.
This analysis aims to understanding the urban networks of Zhengding and its evolution, focusing on four representative years, 1966, 1992, 2008, and 2024, as temporal cross-sections of the evolution process. Meanwhile, as part of the research on the impact of city walls on urban growth, the networks within and outside the city walls are particularly compared.
Space Syntax is used as the major conceptual basis in this analysis. Specifically, two syntactic measurements, Normal Angular Integration (NAIN) and Normal Angular Choice (NACH) were calculated for indicating the accessibility and connection of each section in the road network of Zhengding, and for identifying the centre(s) and structural elements in this network.
The measurements, NAIN and NACH, were calculated using the software depthMapX, a tool dedicated for Space Syntax analysis developed by UCL. And then overlapped with the shadows of built-up areas using Adobe Photoshop and Adobe Illustrator, for better illustration of the urban sprawl process.
Results are shown as follows:
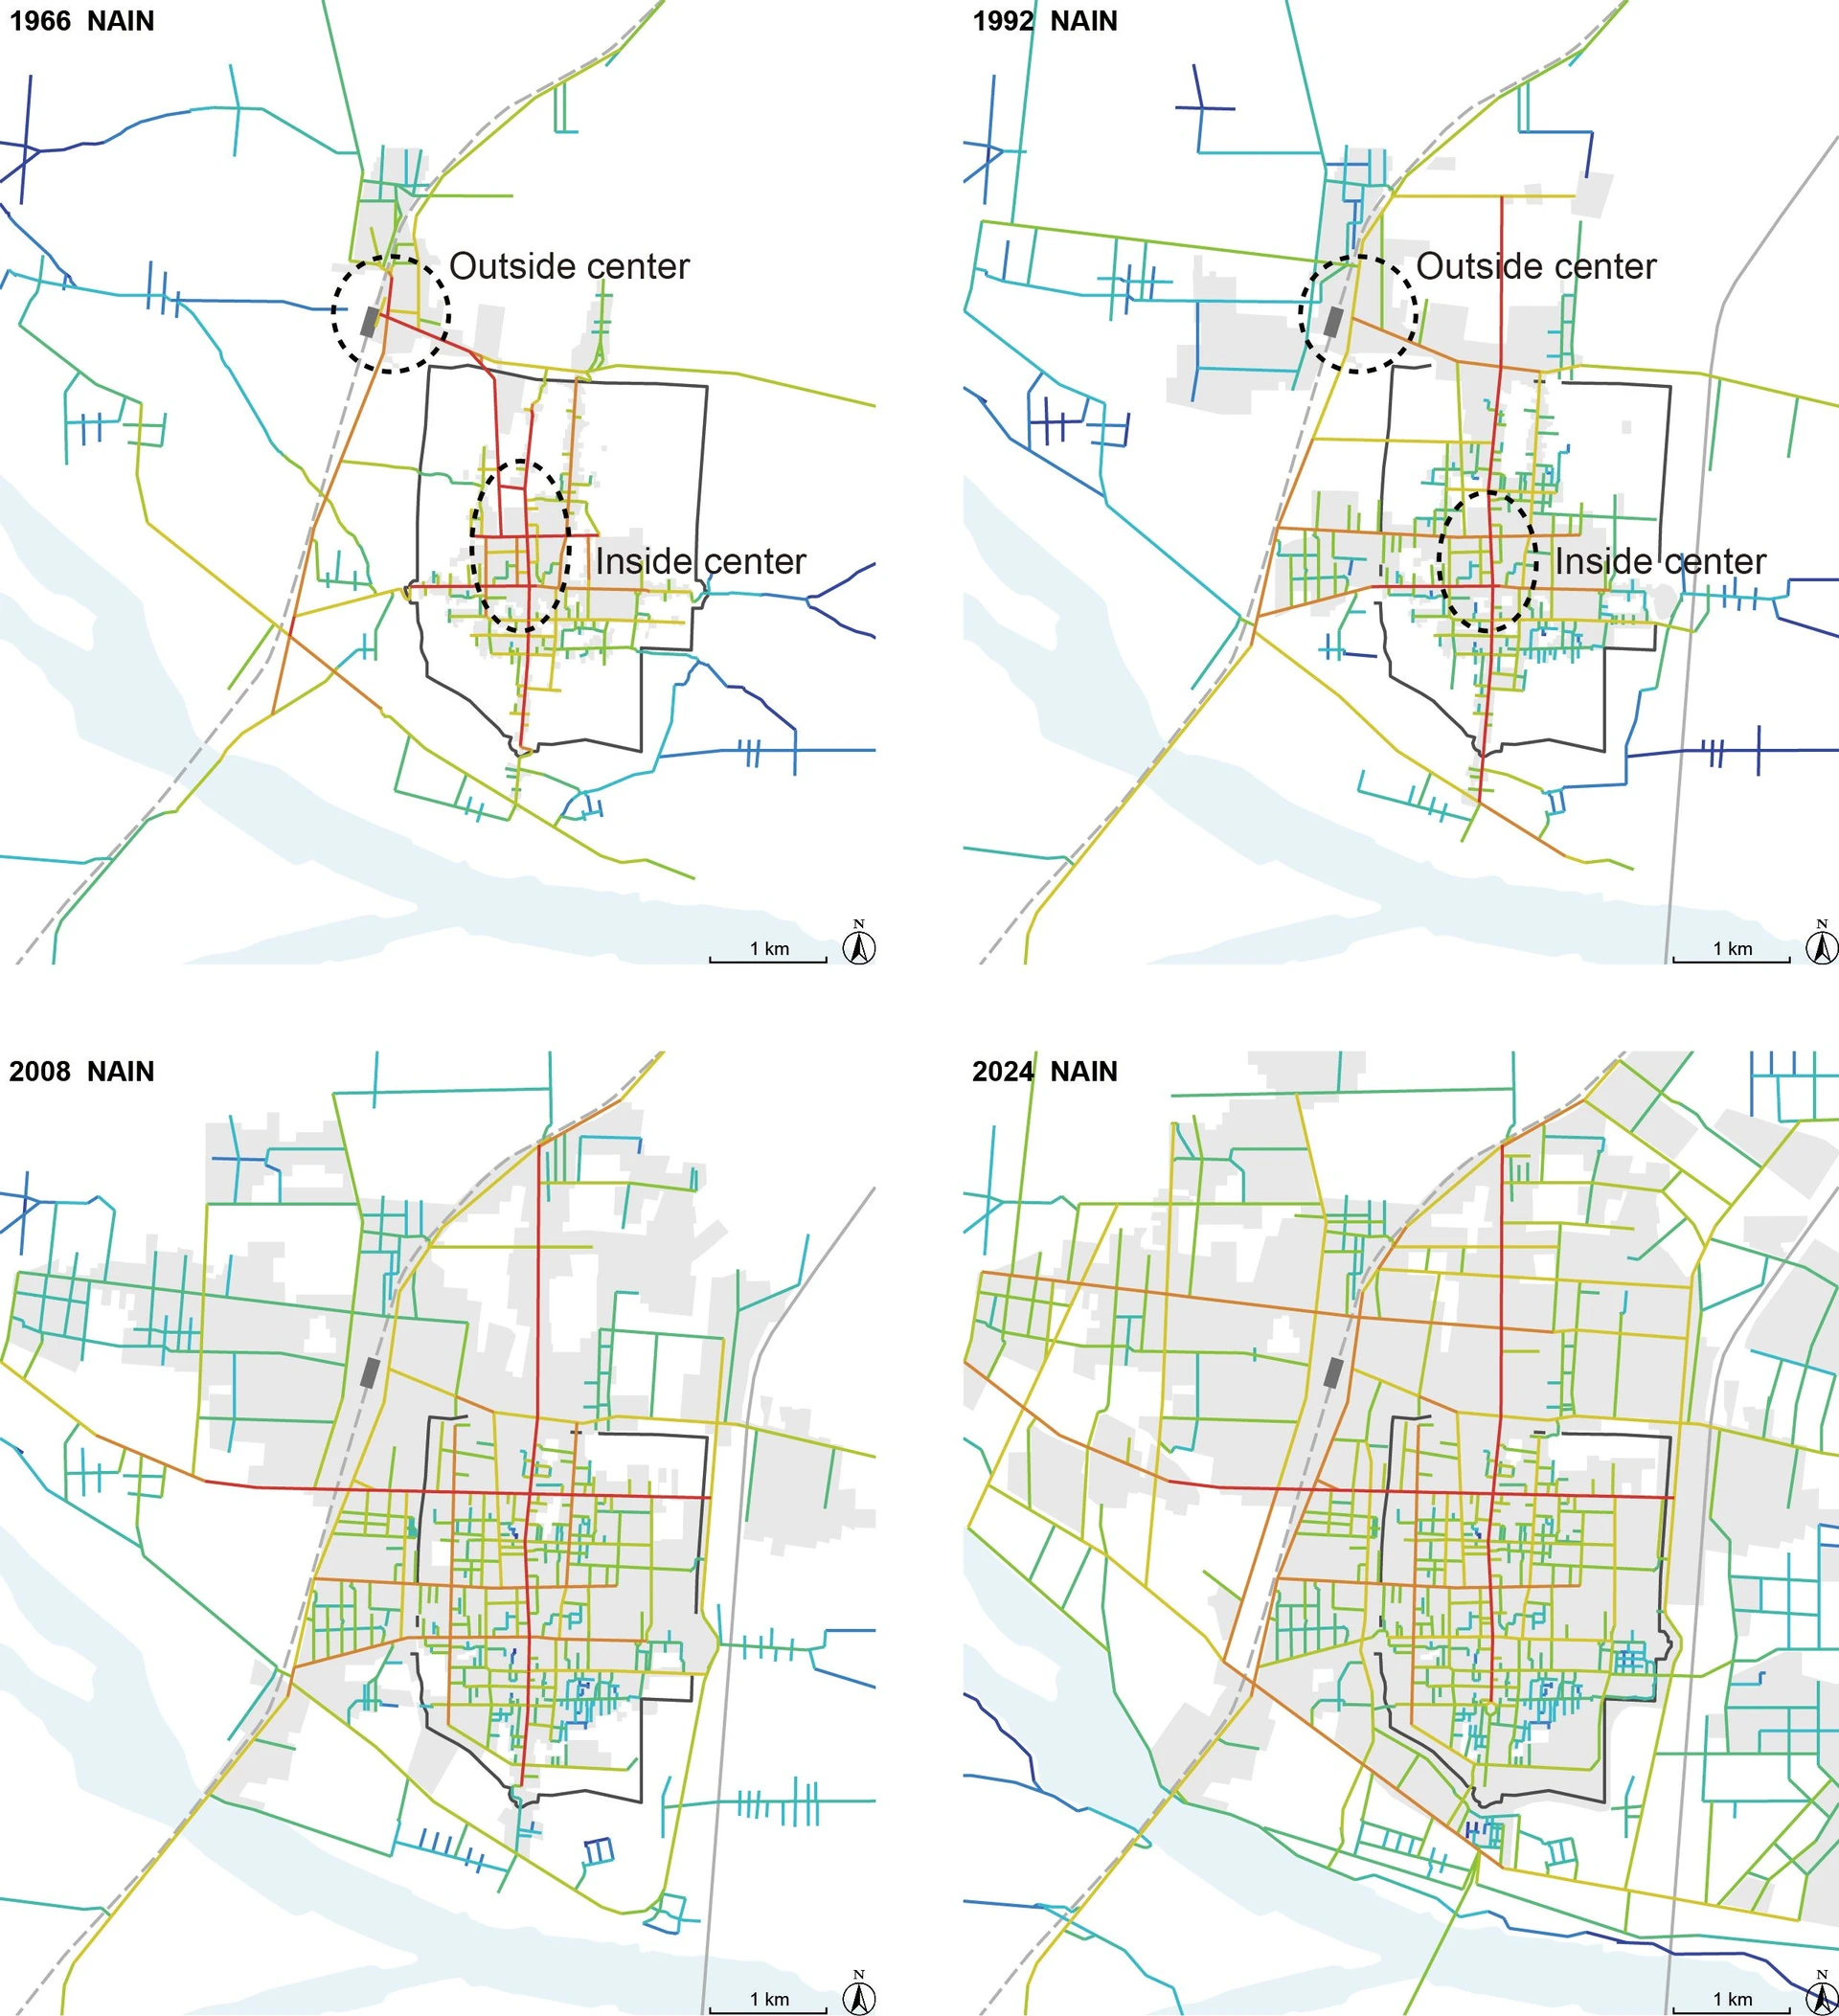
Normal Angular Integration (NAIN) calculation results in the four years. Red colors indicate high NAIN value, while blue colors indicate low values. Centre(s) and structural axes can be identified.
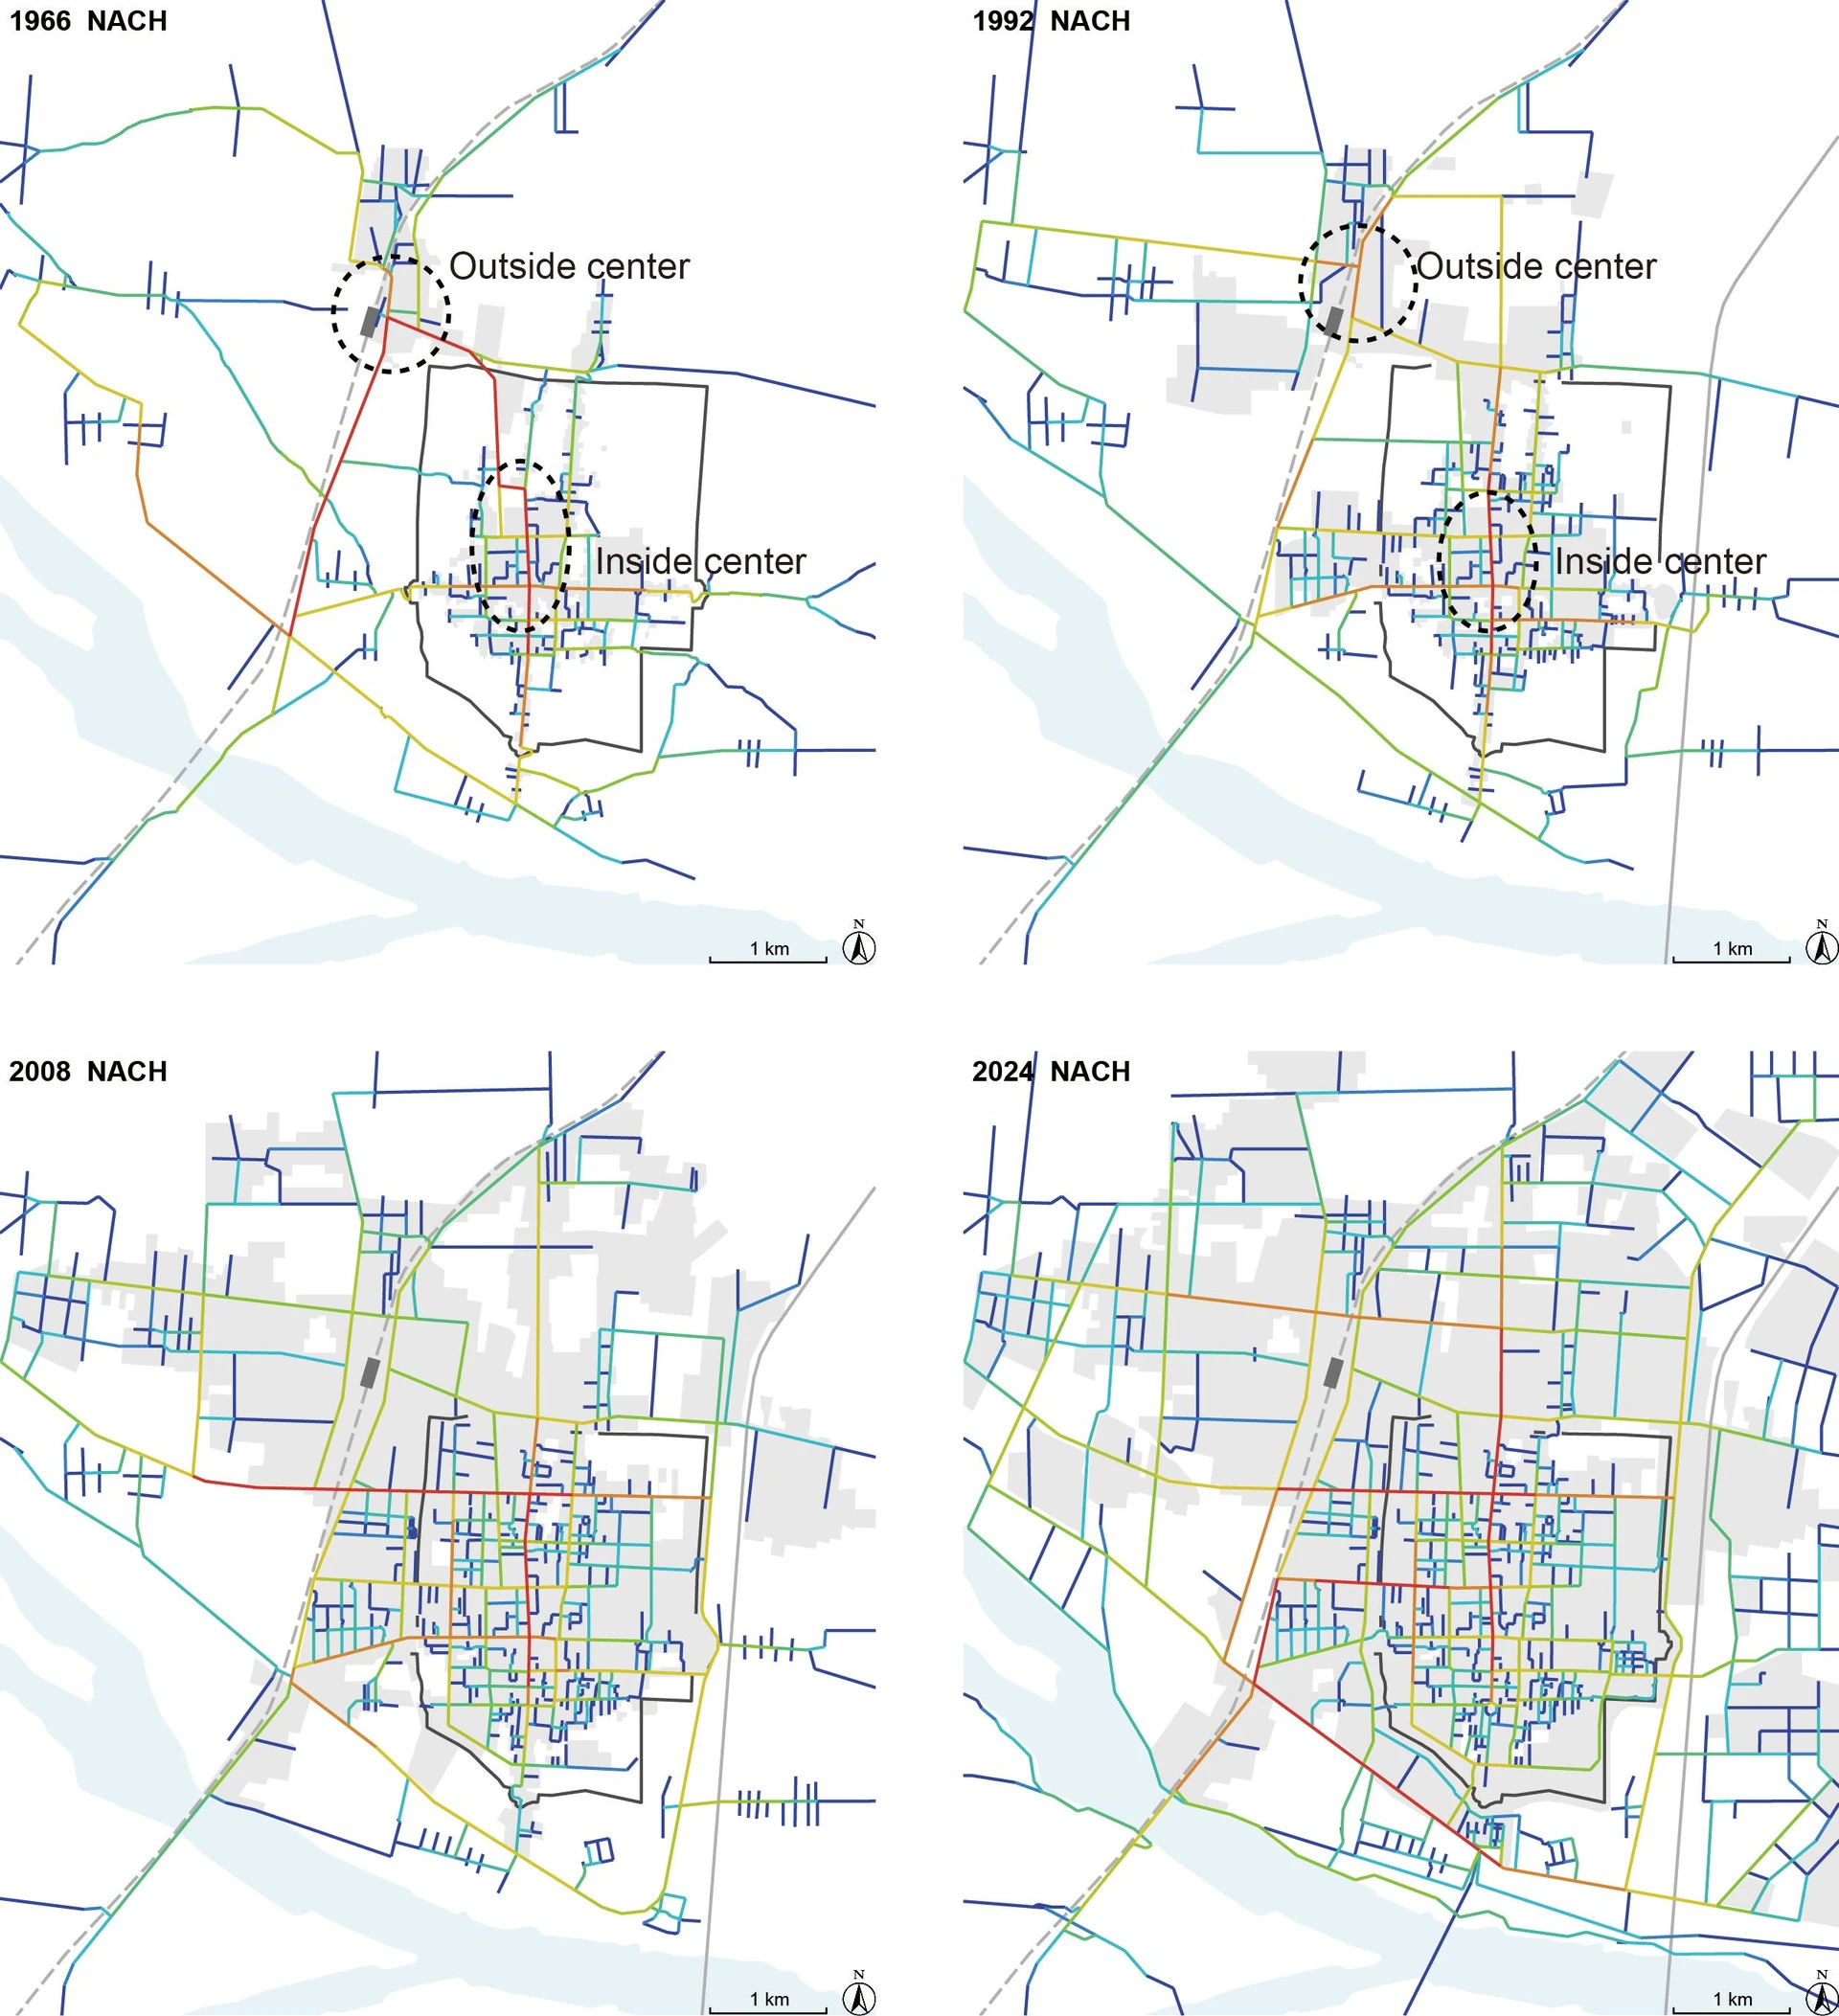
Normal Angular Choice (NACH) calculation results in the four years. Red colors indicate high NACH value, while blue colors indicate low values. Centre(s) and structural axes can be identified.