Visual Integration Analysis of Optics Valley Pedestrian Zone
Methods / Tools
Data Sources
This analysis was part of my master’s thesis research. The optics Valley Pedestrian Zone (光谷步行街) is a popular commercial complex in Wuhan, China. The goal is to understand how the spatial layout in this commercial complex affected user’s visual perception.
Visual Integration is the most critical measurement of the Visual Graph Analysis (VGA) approach as a type of Space Syntax analysis. It measures how one space is visually connected with all other spaces. The more visually connected a space is, the more likely it is to be seen by users, and, in turn, the more likely users are to visit it. A spatial layout with higher overall Visual Integration can better help users get a clear perception of the whole place, thus giving them a greater sense of security and direction, and better walking experience. As a result, stores situated near the spots with high Visual Integration values tend to attract more customers and perform better commercially.
The analysis was conducted using the software depthMapX, a tool dedicated to Space Syntax analysis developed by the Space Syntax team at UCL. By convention, in the analysis results, red colors refer to higher Visual Integration, and blue colors refer to lower.
The analysis calculated the Visual Integration of all the communal spaces (corridors, courtyards) in Optics Vally Pedestrian Zone, excluding the stores. Then, the result images with colors of Visual Integration exported from depthMapX were overlapped with the floor plan.
Results are shown in the following images:
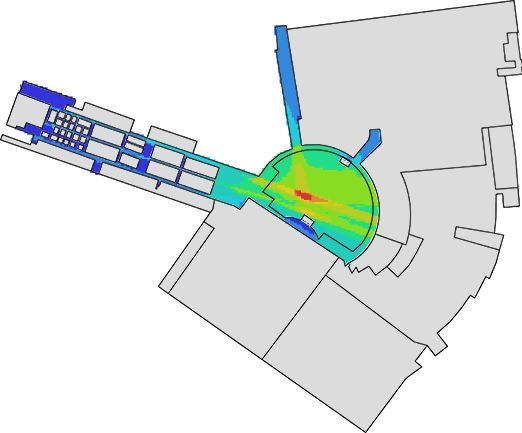
-1 Floor
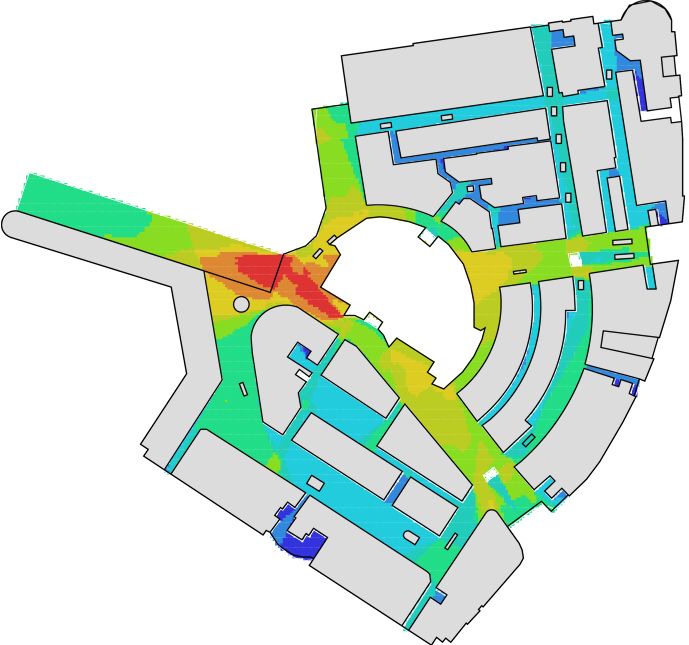
0 Floor
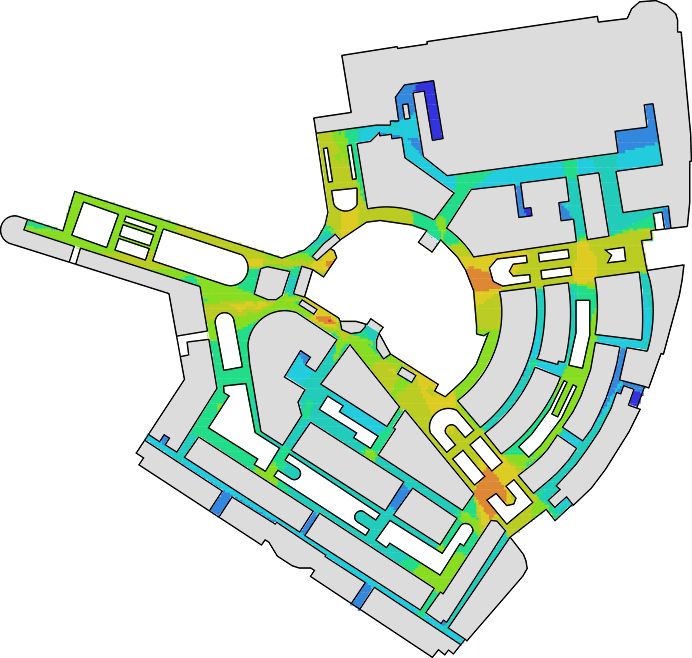
1 Floor
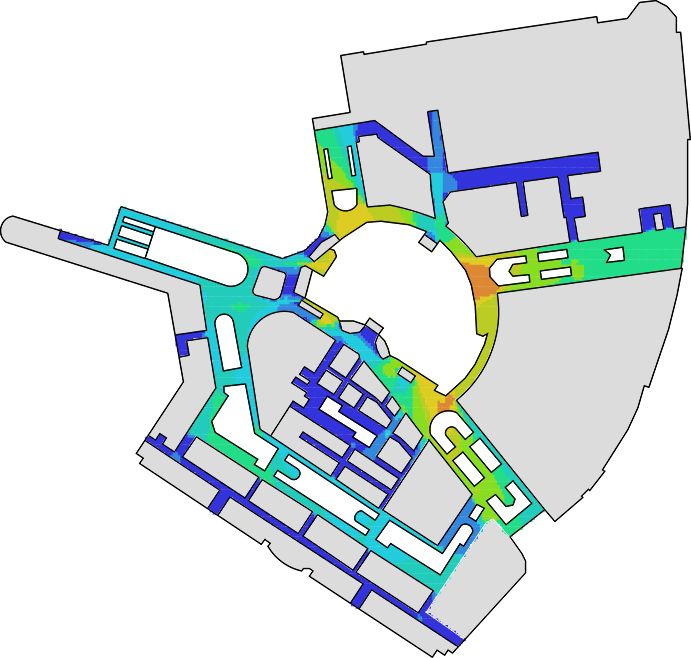
2 Floor
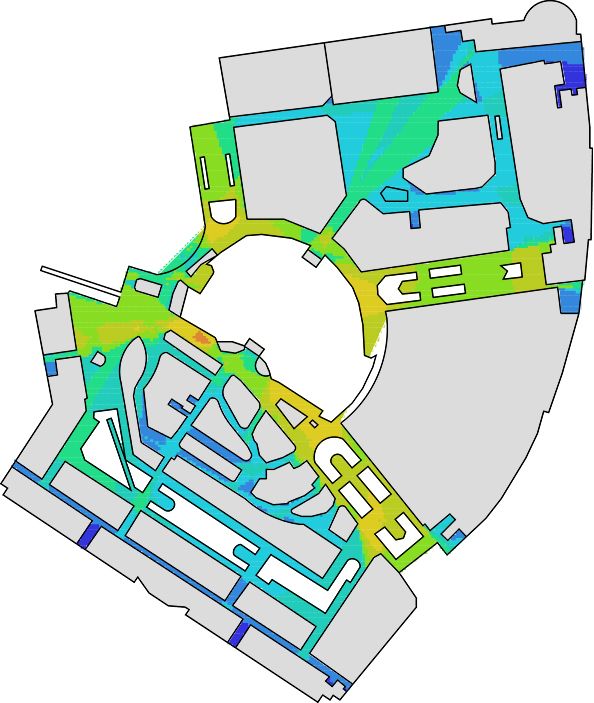
3 Floor
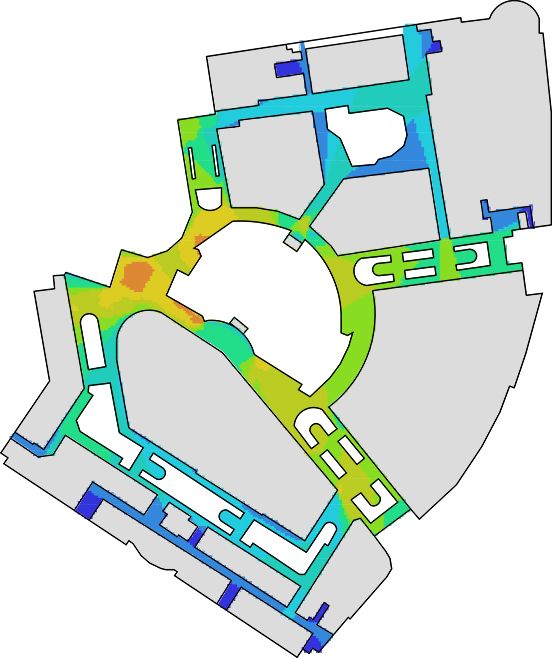
4 Floor
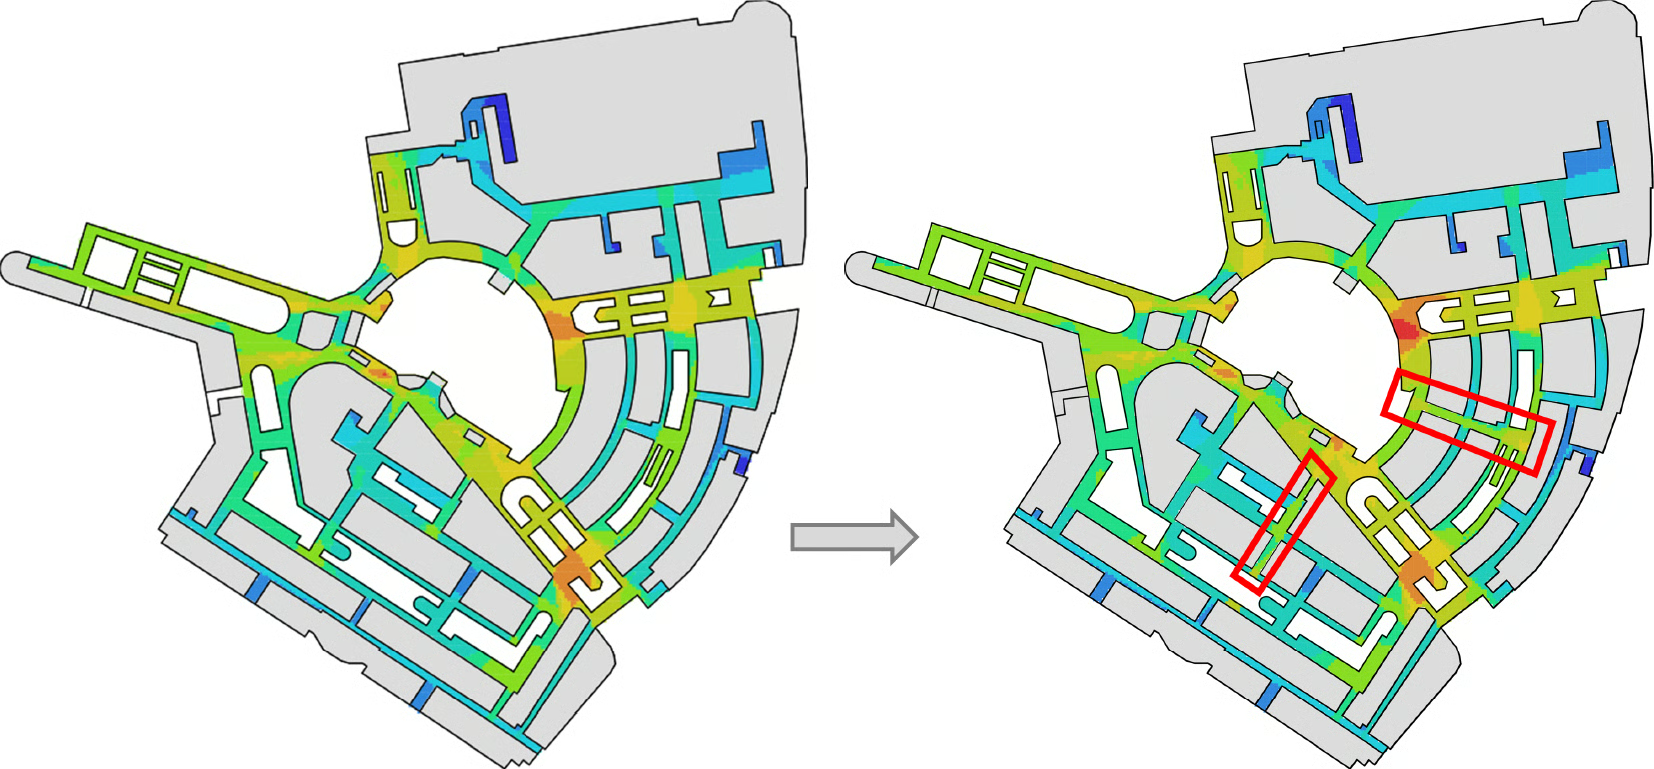
Based on these analysis results, the research also proposed several strategies on improving the overall Visual Integration of the whole complex and to enhance the walking experience, with minimal alteration to the already established spatial layout. For example, two openings were proposed on the 1st floor, as is shown below: